SJC gold bar price
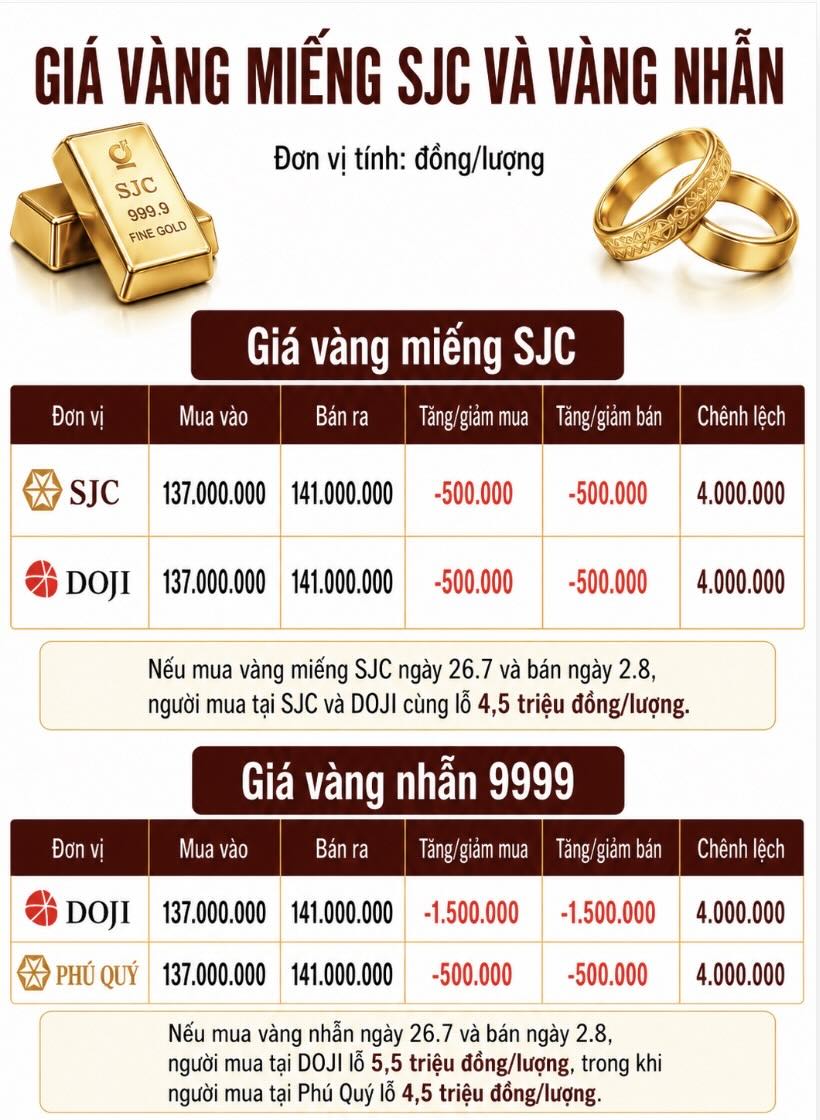
Closing the week's trading session, Saigon SJC Jewelry Company listed SJC gold prices at 137-141 million VND/tael (buying - selling). The buying - selling difference is at 4 million VND/tael.
Compared to the closing session of last week (July 26), the price of SJC gold bars at Saigon SJC Jewelry Company decreased by 500,000 VND/tael in both buying and selling directions.
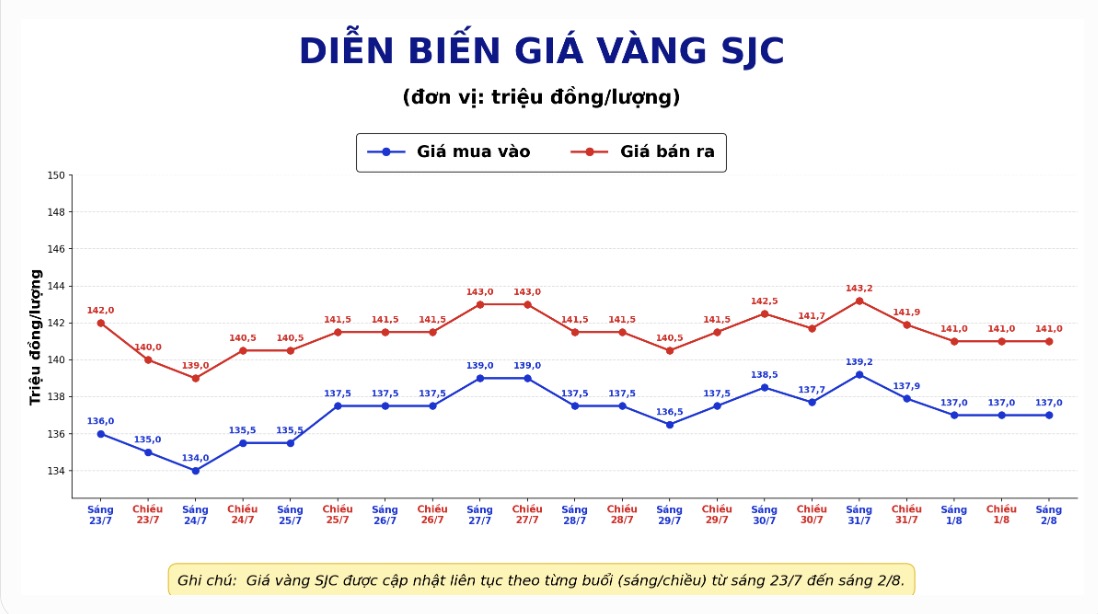
Meanwhile, DOJI listed SJC gold price at 137-141 million VND/tael (buying - selling). The buying - selling difference is at 4 million VND/tael.
Compared to the closing session of last week (July 26), SJC gold bar price at DOJI decreased by 500,000 VND/tael in both buying and selling directions.
If buying SJC gold bars in the session on July 26 and selling them in today's session (August 2), buyers at Saigon SJC and DOJI Jewelry Company both lost 4.5 million VND/tael.
9999 gold ring price
At the same time, DOJI Group listed the price of gold rings at 137-141 million VND/tael (buying - selling), down 1.5 million VND/tael in both buying and selling directions. The buying - selling difference is at 4 million VND/tael.
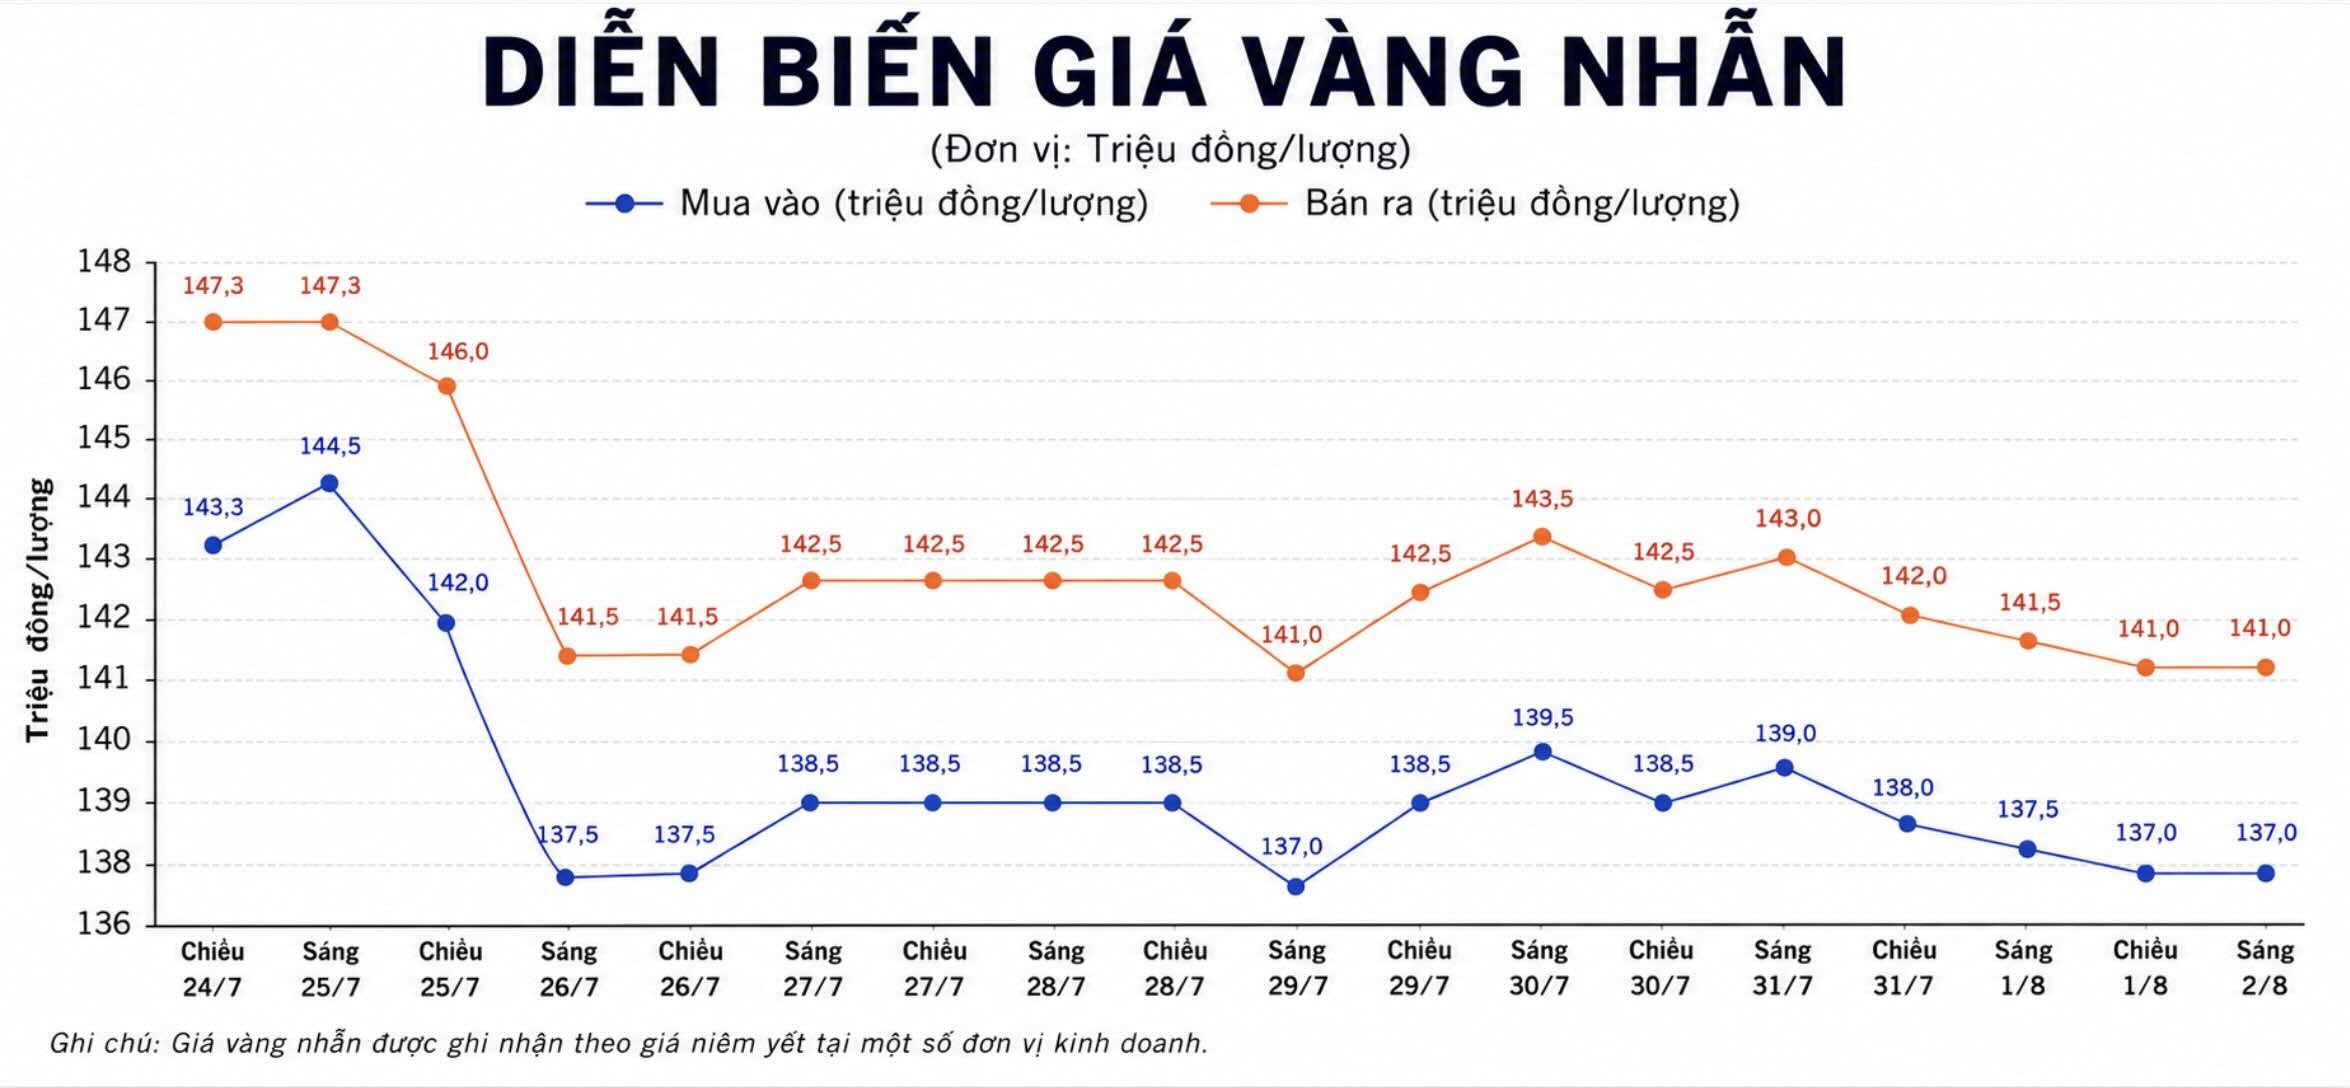
Phu Quy Jewelry Group listed the price of gold rings at 137-141 million VND/tael (buying - selling), down 500,000 VND/tael in both buying and selling directions. The buying - selling difference is at 4 million VND/tael.
If buying gold rings on July 26 and selling them today (August 2), buyers at DOJI will lose 5.5 million VND/tael, while buyers at Phu Quy will lose 4.5 million VND/tael.
World gold price
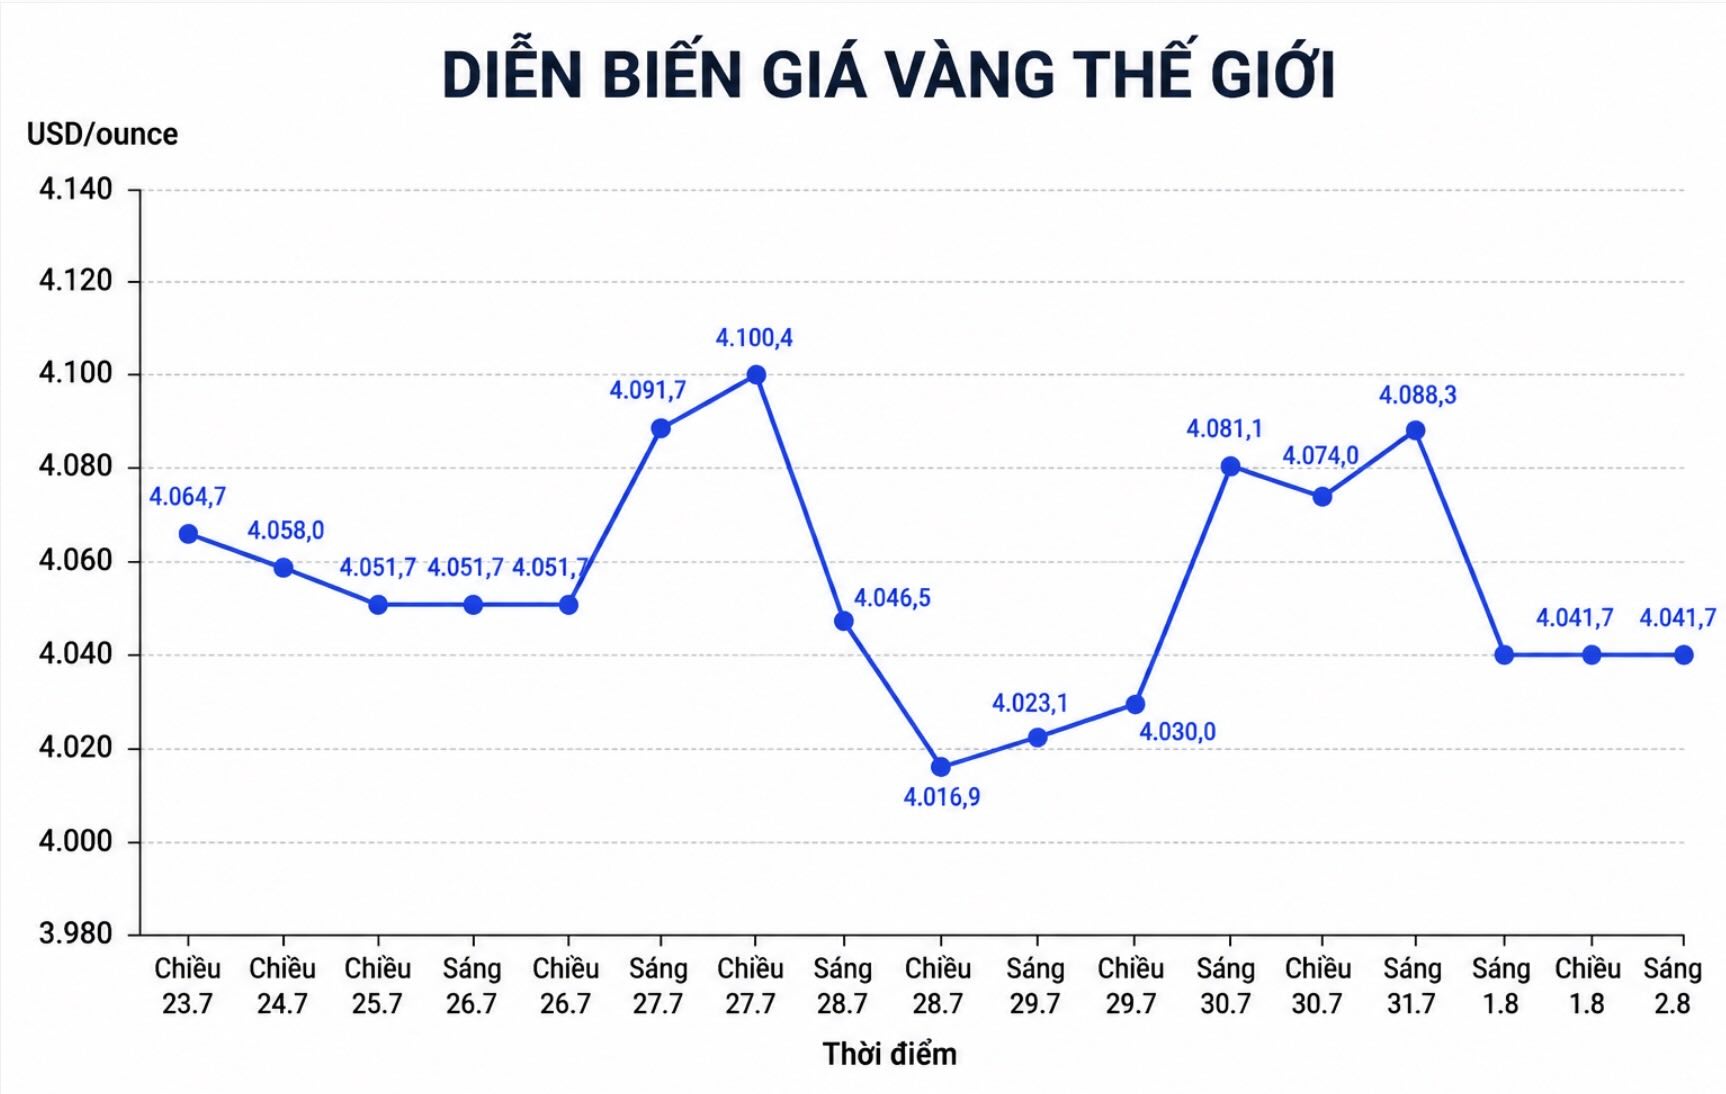
Closing the weekly trading session, world gold prices were listed at 4,041.7 USD/ounce, down 10 USD compared to a week ago.
Gold price forecast
Gold prices are forecast to continue to fluctuate next week as the market has not formed strong enough momentum to escape the current accumulation zone. Although gold recorded its first month of increase since US-Iran tensions broke out, the increase in the month was insignificant and did not show a truly sustainable upward trend.
Technically, the price movement in July forms a candlestick pattern with an opening and closing prices almost equivalent. This pattern reflects the balance between buyers and sellers, and also shows that investors are still cautious in the face of mixed signals from monetary policy, inflation and geopolitical situation.
A noteworthy point is that gold prices have formed bottoms higher than previous bottoms, while many times selling pressure could not push prices deeper below the support area. The fact that bottom levels appear close to each other for many months shows that the current price range is playing the role of an accumulation base. This may be a preparation for a stronger wave of fluctuations, but there is not enough basis to determine whether the price will break through in an upward or downward direction.
In the short term, the 4,000 USD/ounce zone continues to be considered an important support threshold. Every time prices fall below this area, bottom-fishing buying forces quickly appear and pull prices back. However, the upward momentum also often weakens as gold approaches the 4,100-4,120 USD/ounce zone. This shows that the market is still limited to a narrow range.
Pressure on gold mainly comes from high US bond yields, strong USD and increased inflation risk as energy prices rise. Conversely, safe-haven demand in the face of geopolitical tensions, gold buying activities by central banks and expectations that the US Federal Reserve is not in a hurry to raise interest rates may support prices.
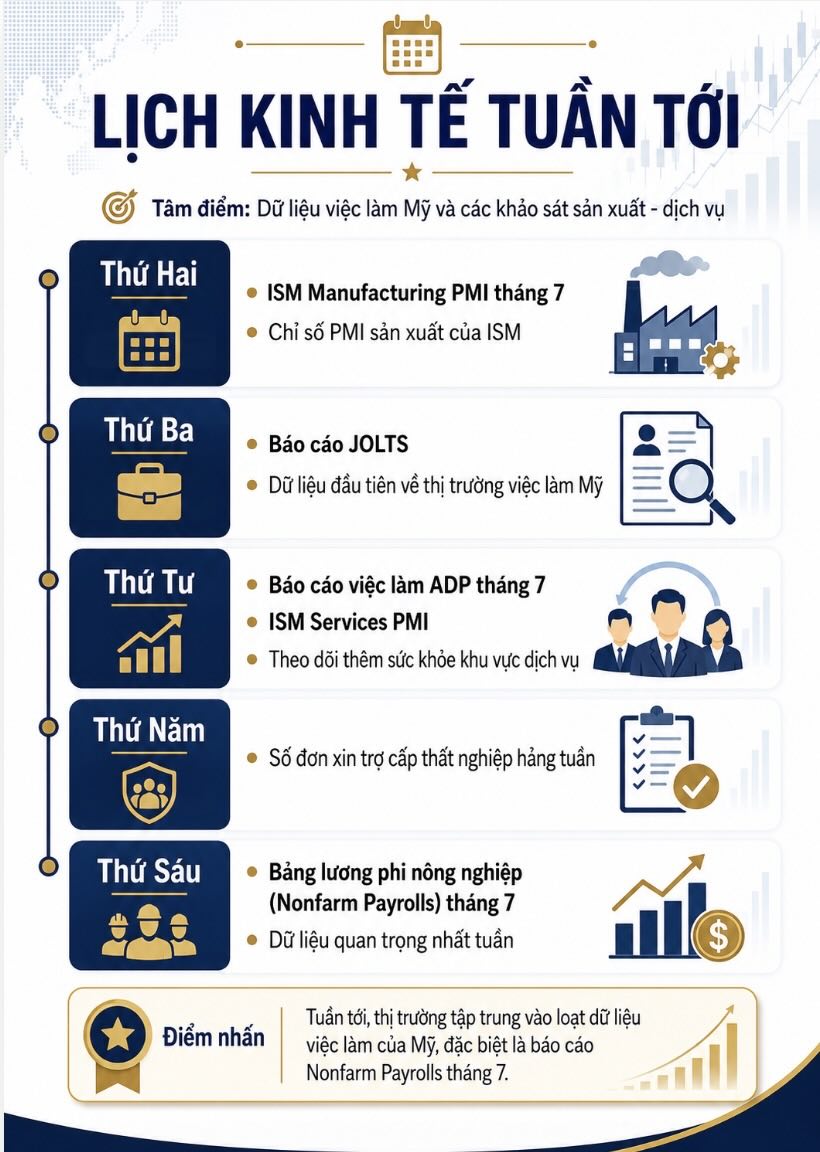
Next week, investors will focus on US manufacturing, service and labor market reports, especially non-farm payroll data. These data may change interest rate expectations, thereby causing gold prices to fluctuate sharply. In the current context, the scenario is likely to be that gold continues to fluctuate around the $4,000/ounce range before clearer signals appear.
Gold price data is compared to a week earlier.
See more news related to gold prices HERE...