Early this morning (August 1), world gold and silver prices simultaneously fell as the USD strengthened, US Treasury bond yields remained high and oil prices continued to rise.
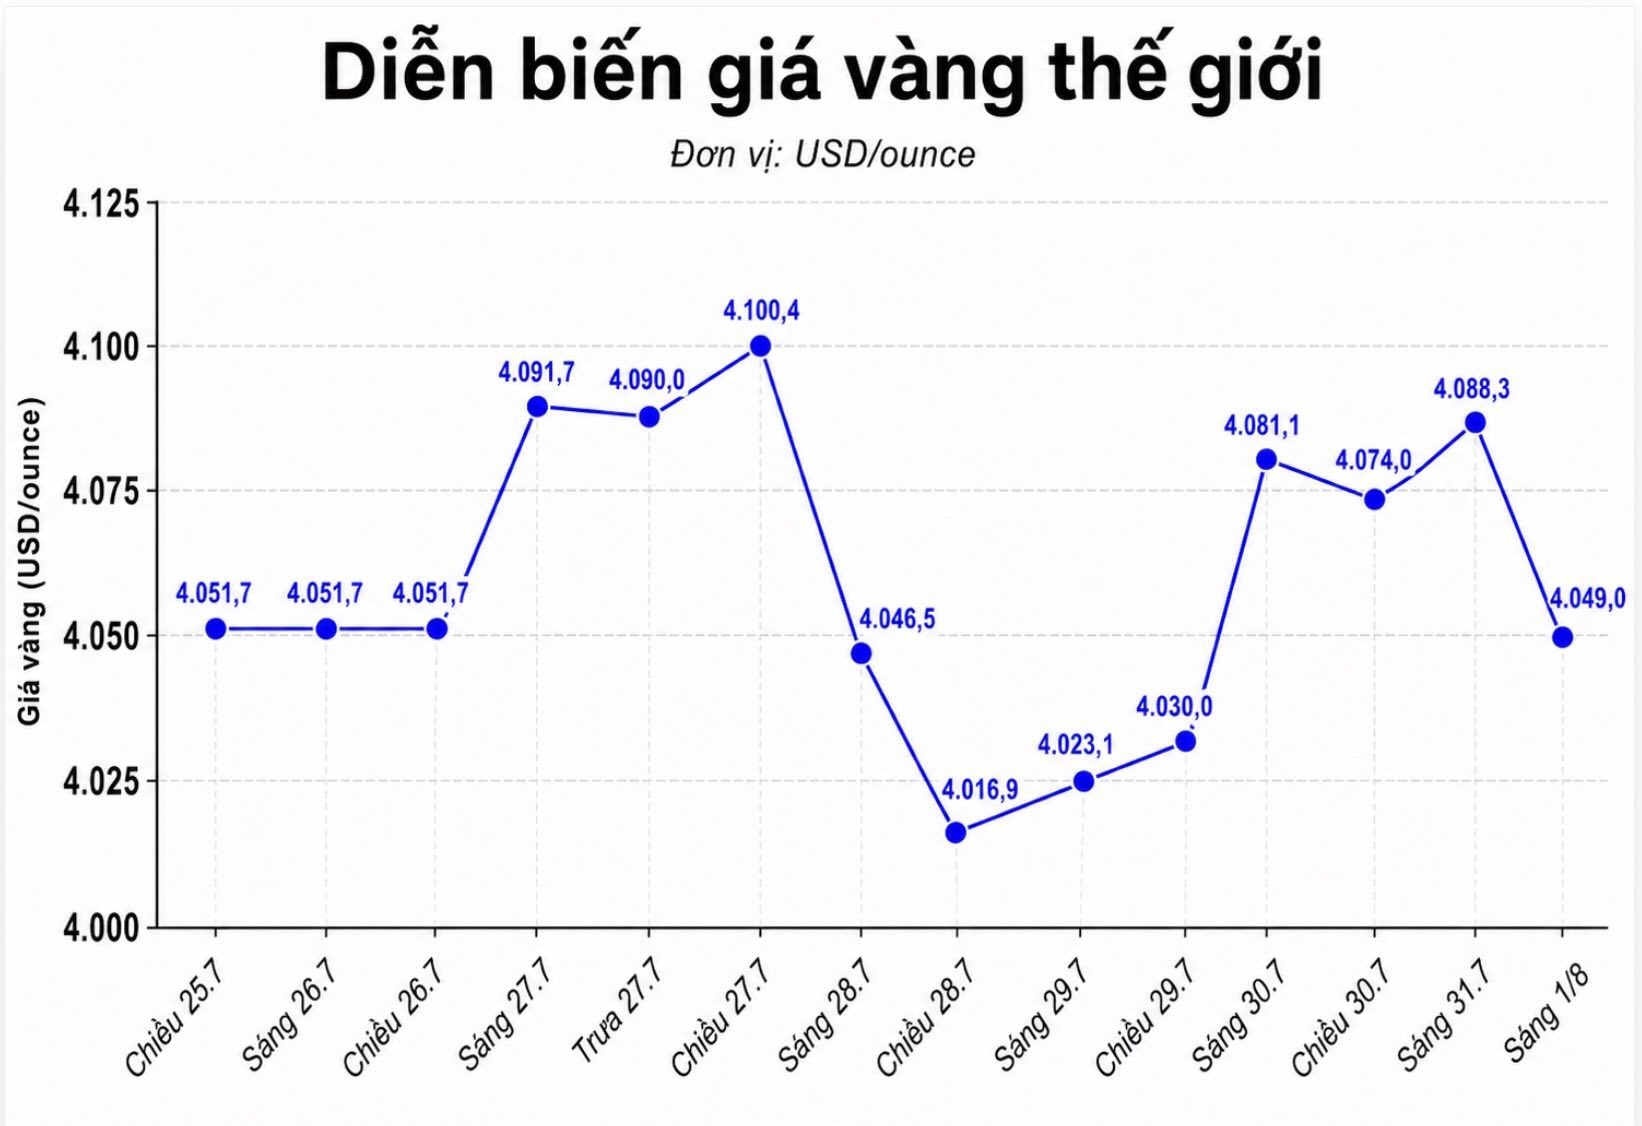
At the recorded time (8:25 am on August 1 - Vietnam time), spot gold price traded around 4,041.7 USD/ounce, down 1.48% compared to the previous session. Spot silver price decreased by 2.45%, to about 57.44 USD/ounce.
In the recent session, gold prices fluctuated from 4,018.2 to 4,112.8 USD/ounce. Although still maintaining the important psychological zone of 4,000 USD/ounce, the precious metal could not maintain its upward momentum after surpassing the 4,101 USD/ounce mark in the previous session.
Gold prices increased insignificantly in July
July marked the first month of gold price increase since the US-Iran conflict broke out. However, the increase in the precious metal was quite modest.
After including the last declining session of the month, gold prices only increased by about 16 USD in July. This development shows that the market mainly moved sideways and accumulated, instead of entering a clear upward trend.
On the monthly chart, gold prices form a doji candlestick pattern with opening and closing prices almost equivalent. This pattern often reflects the tug-of-war between buyers and sellers, not confirming the next direction of the market.
The noteworthy point is that the price bottom in July was higher than the bottom in April. This is also the first time gold prices have formed a higher bottom in many months.
The July bottom is also close to the bottom area that appeared in June and October 2025. The fact that the price repeatedly did not penetrate this area shows that selling pressure is facing difficulties, while consolidating the possibility of the market forming a price base zone.
Pressure from interest rates and oil prices
External factors are still not really favorable for gold. The USD index remained above 101 points, while the yield of 10-year US Treasury bonds stood around 4.7%.
High yields increase the opportunity cost of holding gold, a non-interest asset. This is the reason why gold prices cannot clearly benefit from the cooling US inflation data.
Previously, the US Federal Reserve (Fed) decided to keep interest rates in the range of 3.5-3.75%. However, three members supported raising interest rates by an additional 0.25 percentage points, showing that the risk of further monetary policy tightening has not completely disappeared.
Economic data shows that the US real GDP in the second quarter increased by 1.5% year-on-year, lower than the 2.1% of the first quarter. The core consumer spending price index increased by 0.1% in the month and increased by 3.3% over the same period.
Rising oil prices also have a two-way impact on gold. Geopolitical risks and tensions in the Strait of Hormuz may boost safe-haven demand, but more expensive oil increases inflation concerns, thereby supporting the USD and bond yields.
Waiting for confirmation of new trend
Technically, gold prices are still below the 50-session moving average of around 4,058 USD/ounce and the 100-session moving average of around 4,071 USD/ounce.
The nearest support level is at 4,018.2 USD/ounce. If this zone is lost, the gold price could fall to 3,995.2 USD/ounce, or even 3,959.8 USD/ounce.
In the opposite direction, gold needs to surpass and maintain above 4,101.1 USD/ounce to head towards the levels of 4,114 and 4,166 USD/ounce.
The fact that gold prices closed for the first time above the downward trend line in about 5 months is a positive sign. However, the market still needs to successfully test the old resistance zone before it can confirm a sustainable rally.
The information in the article only reflects market developments, not investment recommendations.