The 200-day moving average is becoming the focus of attention of the gold market, in the context that this precious metal is under strong downward pressure after a series of positive economic data from the US.
For many analysts, this is not only a normal technical indicator, but also an important boundary to assess whether the long-term upward trend of gold will be maintained or not.
According to Mr. Marc Chandler - Managing Director of Bannockburn Global Forex, gold prices are becoming heavier after US jobs data was higher than forecast, while bond yields increased.
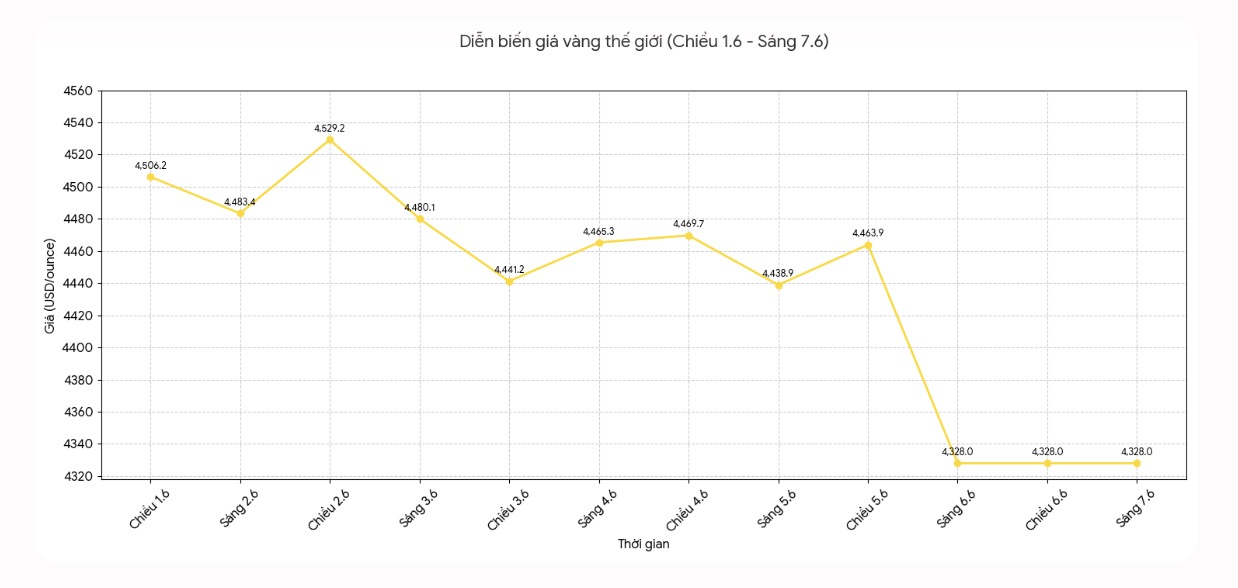
These factors have pulled precious metal prices below the 200-day moving average, around the 4,428 USD/ounce range. He noted that gold has not closed below this threshold since November 2023, so the current price range is of great technical significance.
Gold losing the 200-day moving average occurred in the context of the financial market adjusting expectations for the monetary policy of the US Federal Reserve (Fed). Positive jobs reports weakened expectations that the Fed would soon cut interest rates. When bond yields and the USD increase, gold is often disadvantaged because the precious metal does not yield interest rates.
Mr. Adrian Day - Chairman of Adrian Day Asset Management - believes that gold may continue to move sideways in the range until tensions related to Iran cool down. According to him, the current geopolitical conflict both supports the USD and keeps oil prices at a high level, thereby increasing concerns about higher interest rates. These are all unfavorable factors for gold in the short term.
However, not all experts believe that gold falling below the 200-day moving average is a starting signal for a downward price market.
Mr. Rich Checkan - Chairman and CEO of Asset Strategies International - said that the gold sell-off has been pushed too far. According to him, the actual yield when depositing money in banks is still negative compared to inflation, so gold has not lost its attractiveness as a value-preserving asset.
Another notable perspective comes from Ms. Eugenia Mykulak - founder and CEO of B2PRIME Group. She believes that gold prices are at one of the most notable times in the past year, when the 200-day moving average is tested for the second time. According to her, this is usually a threshold that can determine the long-term trend of the market.

Ms. Mykulak admitted that the short-term picture may be worrying. In May, global gold ETFs recorded capital withdrawals of about 2 billion USD, while investors continued to take profits and transfer part of their capital to US bonds. This shows that speculative capital is becoming more cautious with gold after a period of strong increase before.
However, she emphasized that while short-term capital flows are withdrawing from gold, central banks are still continuing to buy in. In April, central banks around the world returned to net buying status, adding 17 tons of gold to reserves after a period of suspension in March. This is an important fundamental factor supporting gold prices in the long term.
According to Ms. Mykulak, the gold market is currently witnessing a tug-of-war between short-term selling pressure from investors and long-term strategic demand from countries. If the 200-day moving average is maintained, gold may receive more momentum to enter a new upward phase. Conversely, if this threshold is clearly broken, the correction may be longer.
In general, the long-term picture of gold has not completely deteriorated. Reserve demand from central banks, geopolitical risks and the role of safe haven are still important supporting factors. The problem is that in the short term, the market needs more momentum to confirm whether the penetration of the 200-day moving average is just a technical correction, or a sign of a longer period of weakness.
The 200-day moving average is the average price of gold in the last 200 trading sessions. This indicator is often used by investors to identify long-term trends. When the price is above the 200-day moving average, the market is often seen as still in an upward trend. Conversely, if the price breaks through and remains below this threshold, cautious sentiment may increase, leading to technical selling pressure.


