SJC gold bar price
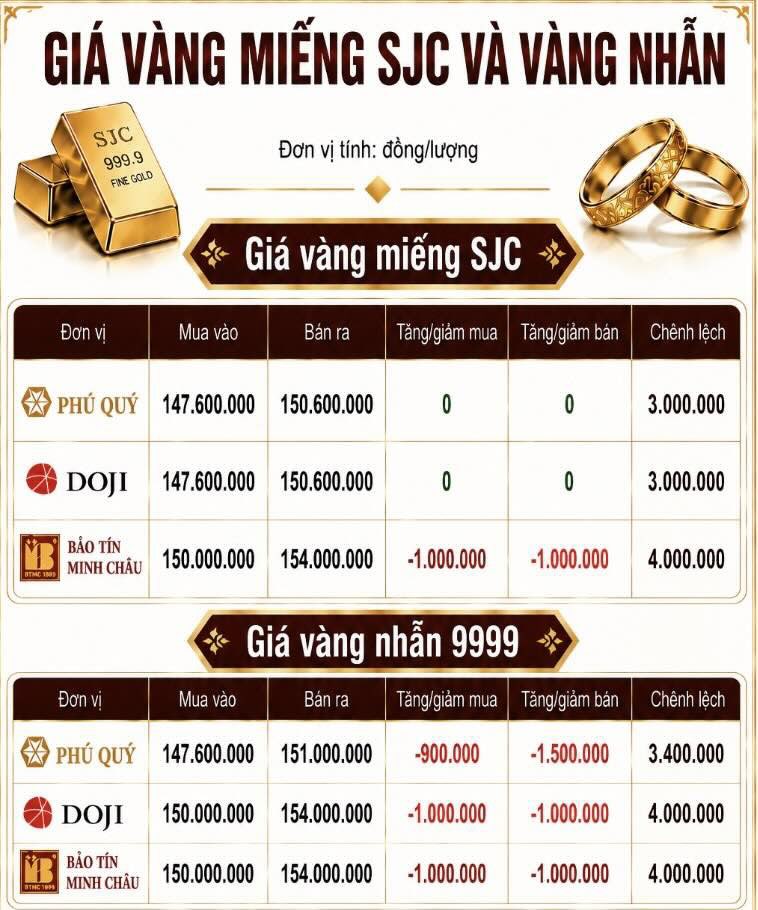
As of 9:10 am, Phu Quy listed SJC gold bar prices at the threshold of 147.6-150.6 million VND/tael (buying - selling), unchanged in both buying and selling directions. The buying - selling difference is at 3 million VND/tael.
At the same time, SJC gold bar prices were listed by DOJI at the threshold of 147.6-150.6 million VND/tael (buying - selling), unchanged in both buying and selling directions. The difference between buying and selling was at 3 million VND/tael.
SJC gold bar price is listed by Bao Tin Minh Chau at the threshold of 150-154 million VND/tael (buying - selling), down 1 million VND/tael in both buying and selling directions. The difference between buying and selling is at 4 million VND/tael.
9999 gold ring price
As of 9:10 am, Phu Quy Gold and Gems Group listed the price of gold rings at 147.6-151 million VND/tael (buying - selling), down 900,000 VND/tael on the buying side and down 1.5 million VND/tael on the selling side. The buying - selling difference is at 3.4 million VND/tael.
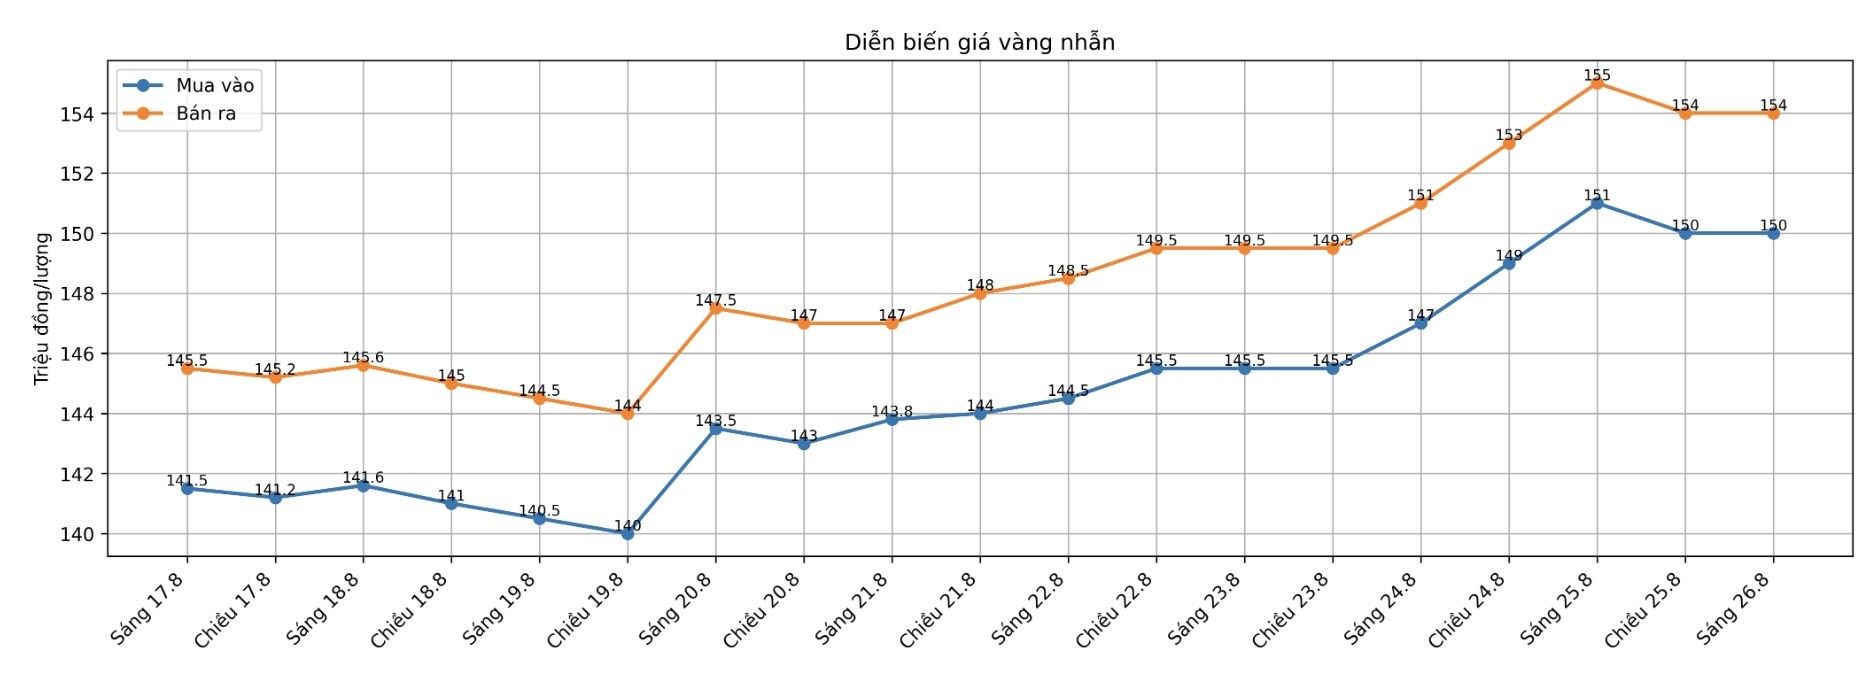
DOJI Group listed the price of gold rings at 150-154 million VND/tael (buying - selling), down 1 million VND/tael in both buying and selling directions. The buying - selling difference is at 4 million VND/tael.
The price of gold rings is listed by Bao Tin Minh Chau at the threshold of 150-154 million VND/tael (buying - selling), down 1 million VND/tael in both buying and selling directions. The difference between buying and selling is at 4 million VND/tael.
World gold price
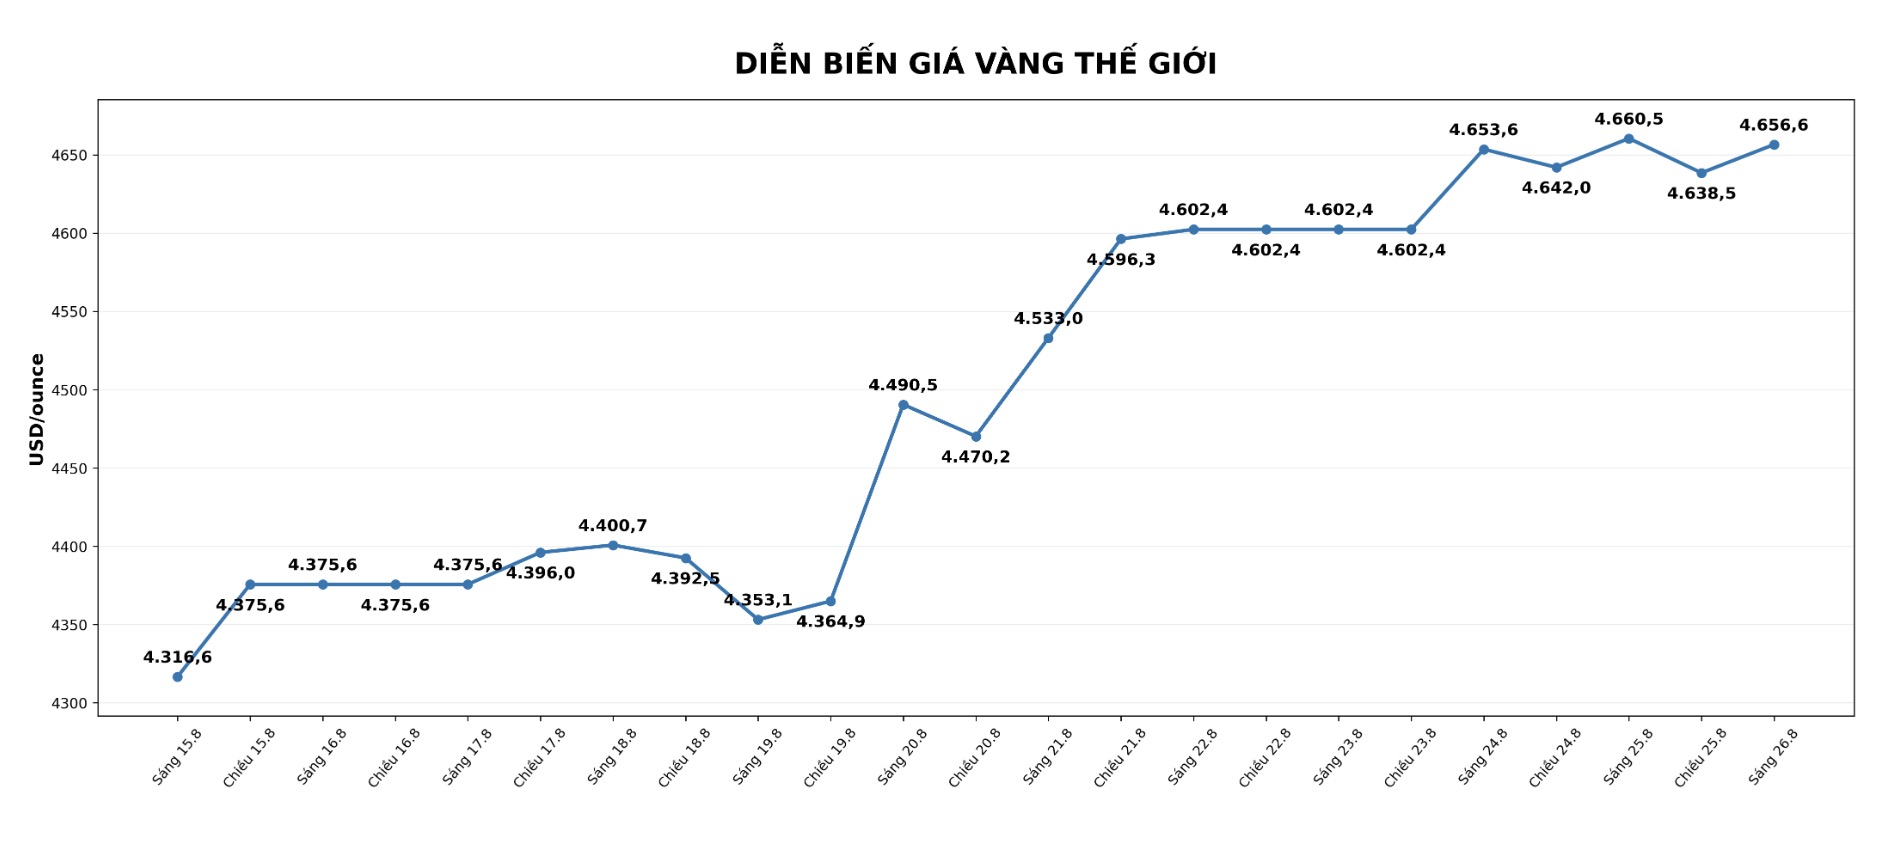
At 9:00 AM, world gold prices were listed around the threshold of 4,656.6 USD/ounce, down 3.9 USD.
Gold price forecast
World gold prices are entering a sideways phase after a strong increase to the highest level in many months. Although profit-taking pressure appeared when the price approached the 4,700 USD/ounce mark, the precious metal still maintained its support base when standing above important technical zones.
On the technical chart, gold prices are currently still maintained in areas considered important support points. In which, the price zone around the Fibonacci 38.2% level and the 200-day moving average line are playing a supporting role, helping to limit the decline of precious metals. In other words, although selling pressure appears after a strong increase, buying power is still appearing in important price zones, showing that the upward trend has not been broken.
However, after a series of consecutive increasing sessions, investor caution is increasing. The appearance of tug-of-war signals on the chart shows that buyers and sellers have not created a clear advantage. In case selling pressure increases and prices break important support zones, the market may enter a correction phase to rebalance after a period of hot increase.
In the opposite direction, fundamental factors are still creating a foothold for gold prices. Signs of weakening in some sectors of the US economy, especially the housing market and consumer sentiment, are increasing expectations about the possibility that the US Federal Reserve (Fed) may adjust monetary policy towards greater easing in the near future.
In addition, concerns about financial pressure, geopolitical instability and the need to seek safe assets are still driving forces supporting gold in the long term. However, the diễn biến of the USD, US bond yields and new signals from the Fed will continue to play a decisive role in the next trend of the precious metal.
Technically, the 4,650-4,700 USD/ounce zone is an important test area. If it overcomes this resistance zone with strong buying power, gold prices may aim for higher targets. Conversely, if it cannot maintain the upward momentum, the market may continue to fluctuate in the accumulation zone before determining a new trend.
Gold price data is compared to the previous day.
The information in the article is for reference only, reflecting market developments at the time of recording and not an investment recommendation. Investors need to carefully consider their financial capacity, personal goals and related risks before making a decision to buy or sell gold.
* Fibonacci in technical analysis is a tool used by investors to identify price zones that can become support or resistance points in the price up or down process.
See more news related to gold prices HERE...